drawPitVBL: Difference between revisions
Jump to navigation
Jump to search
m (Text replacement - "<source" to "<syntaxhighlight") |
m (Minor fixes) |
||
| (One intermediate revision by the same user not shown) | |||
| Line 9: | Line 9: | ||
|usage= | |usage= | ||
<syntaxhighlight lang="mtmacro" line> | <syntaxhighlight lang="mtmacro" line> | ||
drawPitVBL( | drawPitVBL(shapeArray) | ||
</syntaxhighlight> | </syntaxhighlight> | ||
| Line 16: | Line 16: | ||
'''Parameters''' | '''Parameters''' | ||
{{param| | {{param|shapeArray|A [[JSON Array]] of [[JSON Object|JSON objects]], one of the latter for each Pit VBL shape. See {{func|drawVBL}} for a complete description of possible shapes}} | ||
| Line 34: | Line 34: | ||
|also= | |also= | ||
[[Introduction to Vision Blocking ]], {{func|erasePitVBL}} | [[Introduction to Vision Blocking]], {{func|erasePitVBL}} | ||
}} | }} | ||
[[Category:Miscellaneous Function]] | [[Category:Miscellaneous Function]] | ||
[[Category:VBL Function]] | [[Category:VBL Function]] | ||
Latest revision as of 23:59, 5 June 2023
drawPitVBL() Function
Note: This function can only be used in a Trusted Macro
• Introduced in version 1.11.0
Draws Pit Vision Blocking Layer (Pit VBL) shapes.
Usage
drawPitVBL(shapeArray)This function works EXACTLY the same as erasePitVBL() with the ONLY difference that drawPitVBL draws the shapes on the Pit Vision Blocking Layer and erasePitVBL() erases them.
Parameters
shapeArray- A JSON Array of JSON objects, one of the latter for each Pit VBL shape. See drawVBL() for a complete description of possible shapes
Example
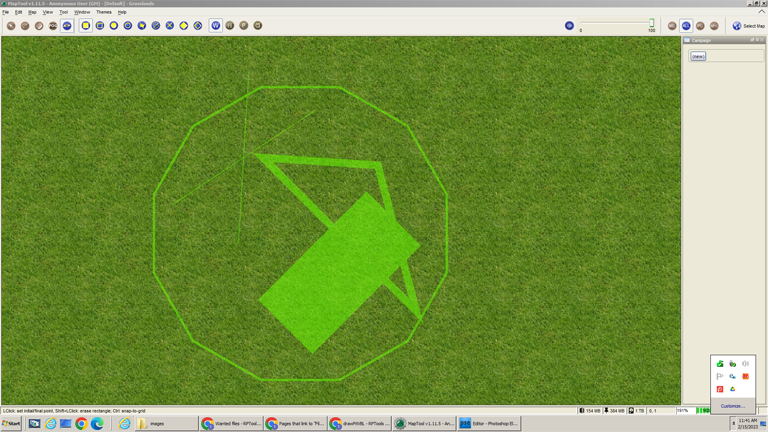
This example builds an array of the object from the above examples and then feeds that array into the drawPitVBL function

[h:rectangle	= "{'shape':'rectangle','x':50,'y':50,'w':100,'h':200,'r':45,'fill':1,'thickness':1,'scale':0}"]
[h:cross	= "{'shape':'cross','x':-50,'y':-50,'w':50,'h':100,'r':30,'fill':1,'thickness':1,'scale':2}"]
[h:circle	= "{'shape':'circle', 'x':50, 'y':100, 'radius':200, 'thickness':3, 'fill':0, 'sides':12,'r':45}"]
[h:polygon	= "{'shape':'polygon','r':0,'close':1,'thickness':10,'points':[{'x':0,'y':0},{'x':200,'y':200},{'x':150,'y':10}]}"]
[h:objectArrary	= json.append('',rectangle, cross, circle, polygon)]
[h:drawPitVBL(objectArrary)]
results in:
